Shane Parrish’s essay The Map is Not the Territory begins:
The map of reality is not reality. Even the best maps are imperfect. That’s because they are reductions of what they represent.
The same is true for product roadmaps. Understanding and applying Parrish’s mental model is the key to designing a more usable, more maintainable, and more accurate roadmap.
What maps miss
Returning to Parish’s quote: “[Maps are] reductions of what they represent.” Map makers have choices when reducing the information they are representing. Take a map of the earth’s surface, for example:
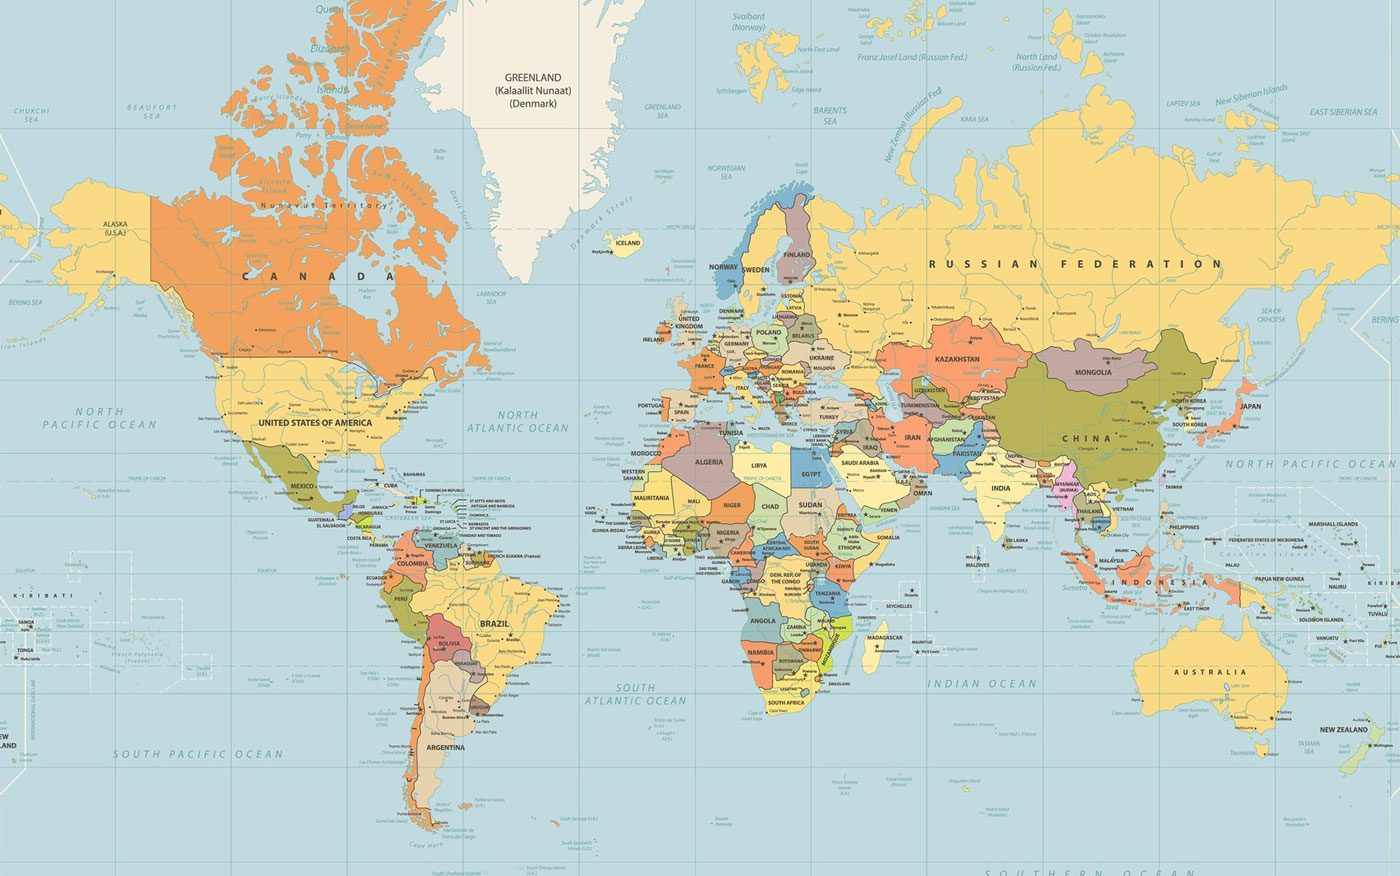
The Mercator projection keeps information about straight lines of travel, but reduces information about areas of land. As a result, the map works great for ocean navigation, but grossly distorts the actual size of the continents1.
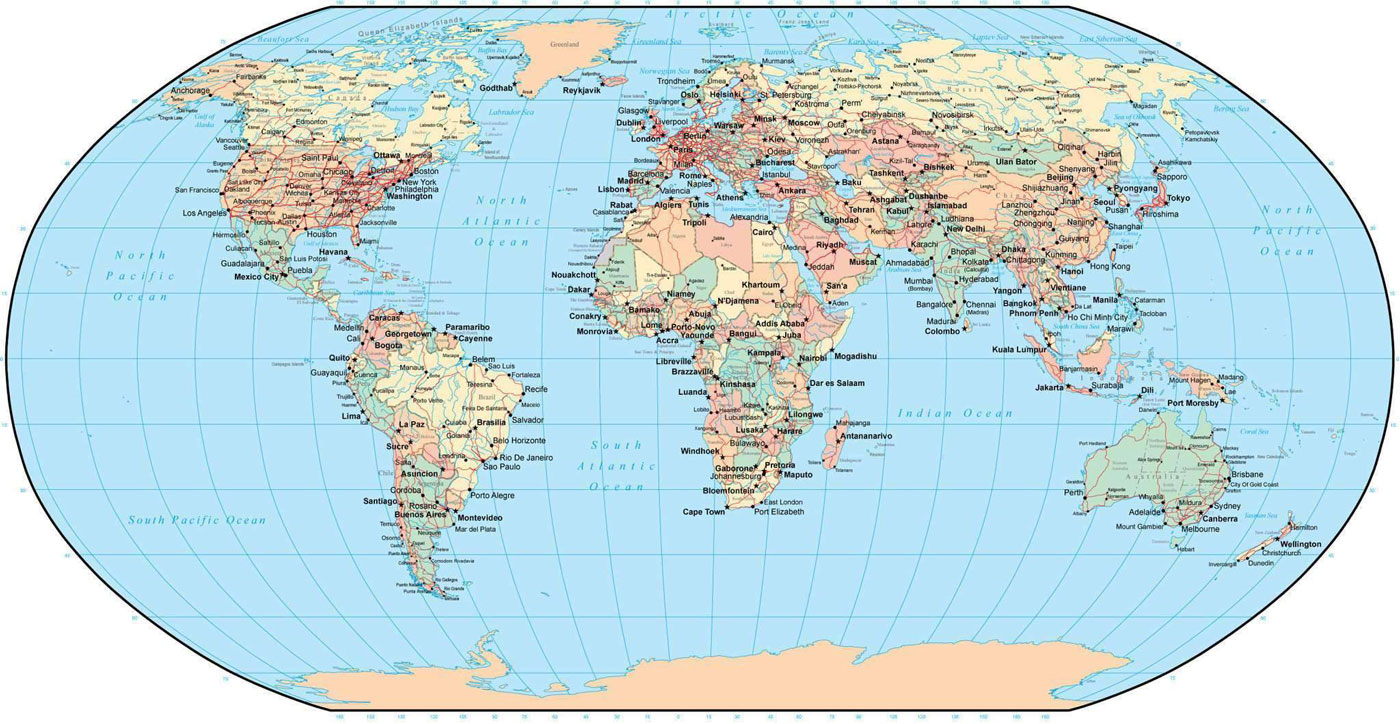
The Robinson projection keeps information about the general shape, size, and location of the continents, but reduces the accuracy of measurements over long distances. This results in a map that’s great for teaching children about geography, but would be useless as a navigational aid.
Product roadmaps are reductions, too. Roadmaps reduce product strategy down to a very digestible (and very power-pointable) format. In doing so, roadmap-makers ask questions: who will be using this map? Is it for education, or navigation? Which information should be preserved, and which can be distorted?
What traditional roadmaps miss
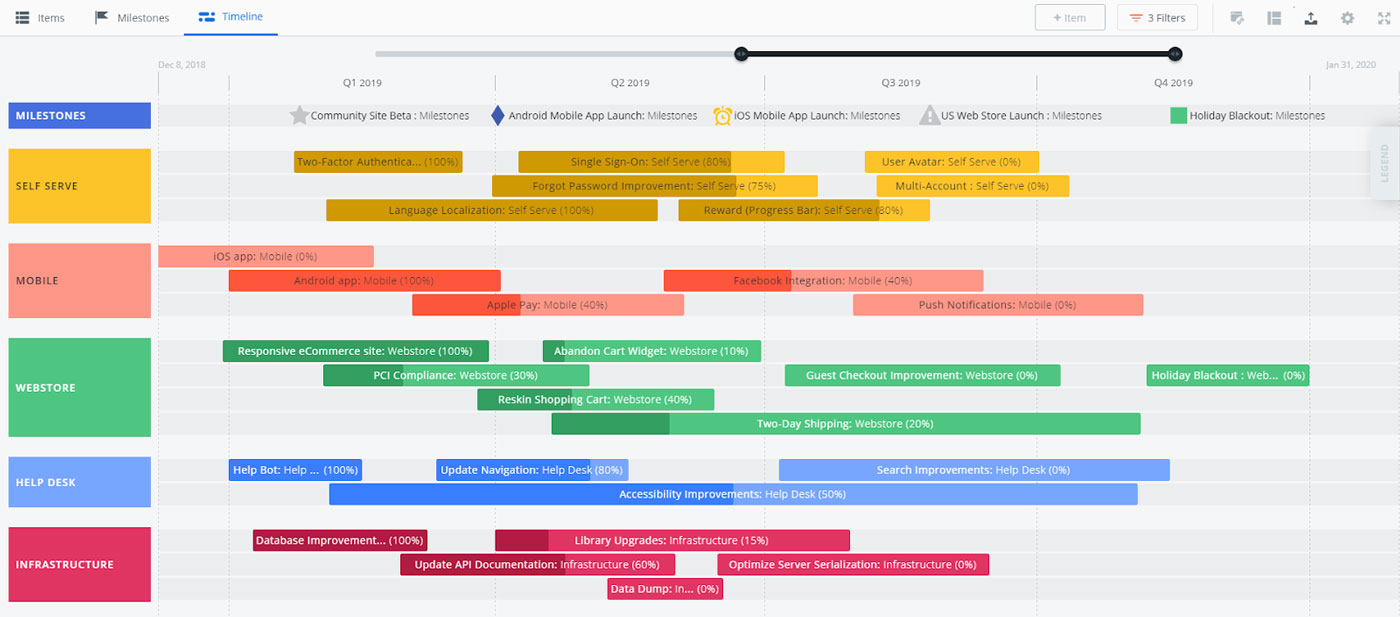
Most modern product roadmaps look like this: One axis is time, the other is goals. Each goal is painted across a span of time, representing when the goal is to be achieved.
This format, called a Gantt chart, was invented more than 100 years ago. By visualizing complicated processes over long periods of time, Gantt charts enabled factory managers to identify and eliminate inefficiency.
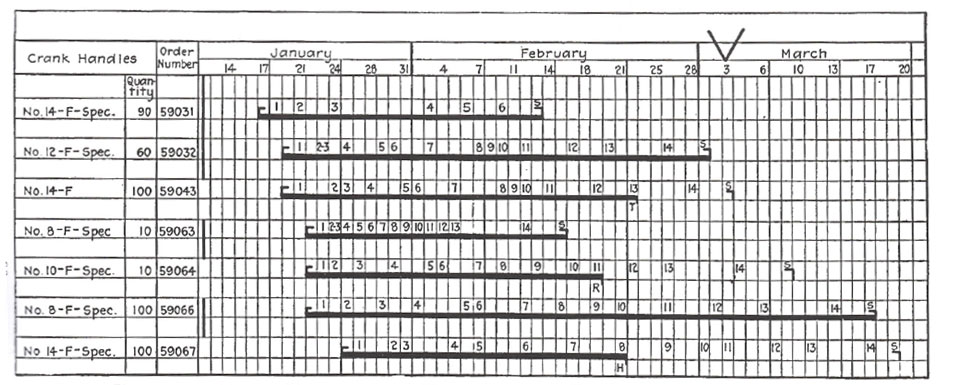
The measurement-driven approach to work (sometimes called scientific management or Taylorism) was a major innovation during the second industrial revolution. Precise planning and management enabled workers to understand and control the intricacies of mass manufacturing.
Over the past century, the nature of work has changed for most people. Instead of overseeing assembly lines of human-operated machines with interchangeable parts, most managers oversee cross-functional teams comprising knowledge workers and specialized technicians.
But we still use Gantt charts. We think our roadmap looks like this:
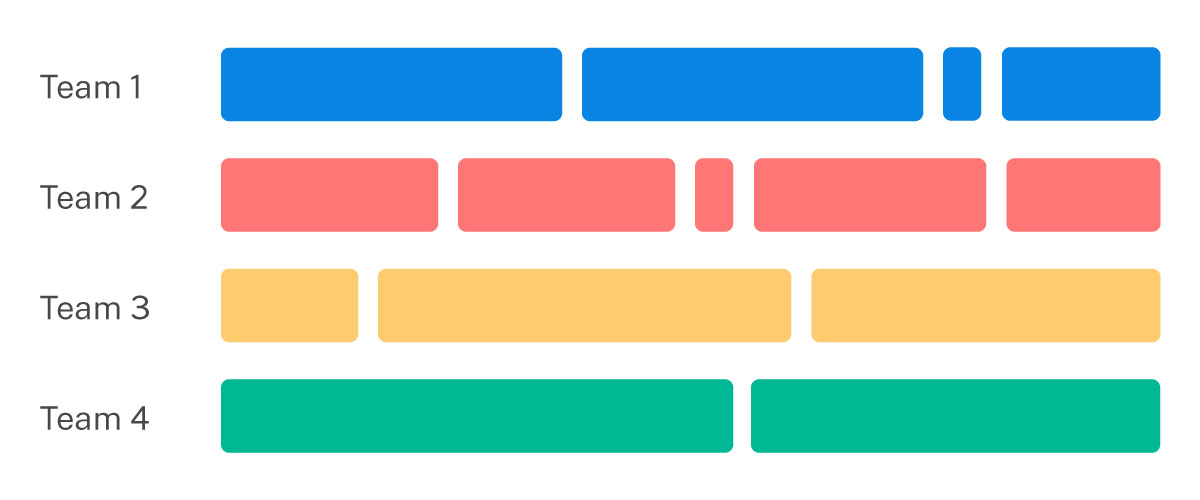
When in reality, it looks like this:

Gantt charts make sense of complicated processes. But software development isn’t merely complicated. It is complex, unpredictable, and at times chaotic. Traditional roadmaps can’t make sense of complexity.
Gantt charts visualize output. But software teams don’t succeed on output alone; our work is no longer about our output in widgets-per-day; we now drive outcomes, real impact to our customers’ lives. Traditional roadmaps can’t visualize outcomes.
Instead of trying to precisely predict the order and magnitude of our output, let’s draw a responsive roadmap2 that visualizes the process of turning uncertainty and complexity into outcomes and output.
What is a responsive roadmap?
A responsive roadmap is a story of how a team will accomplish their goals. Any team can create, publish, and maintain their own roadmap.
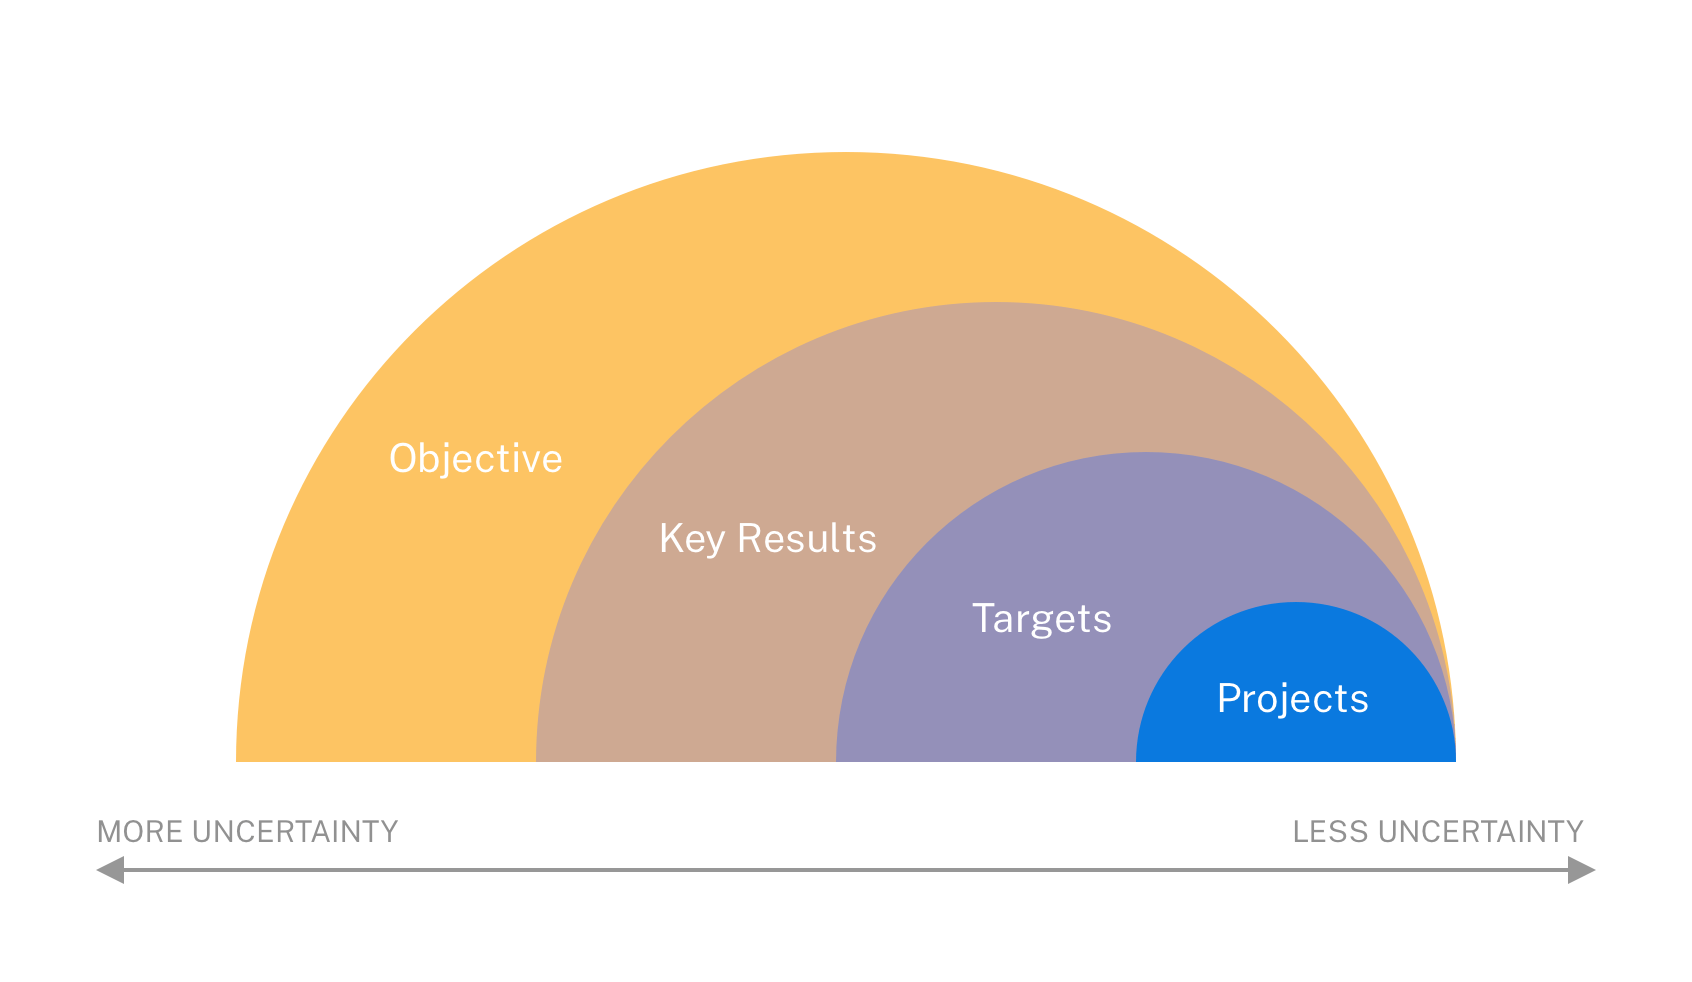
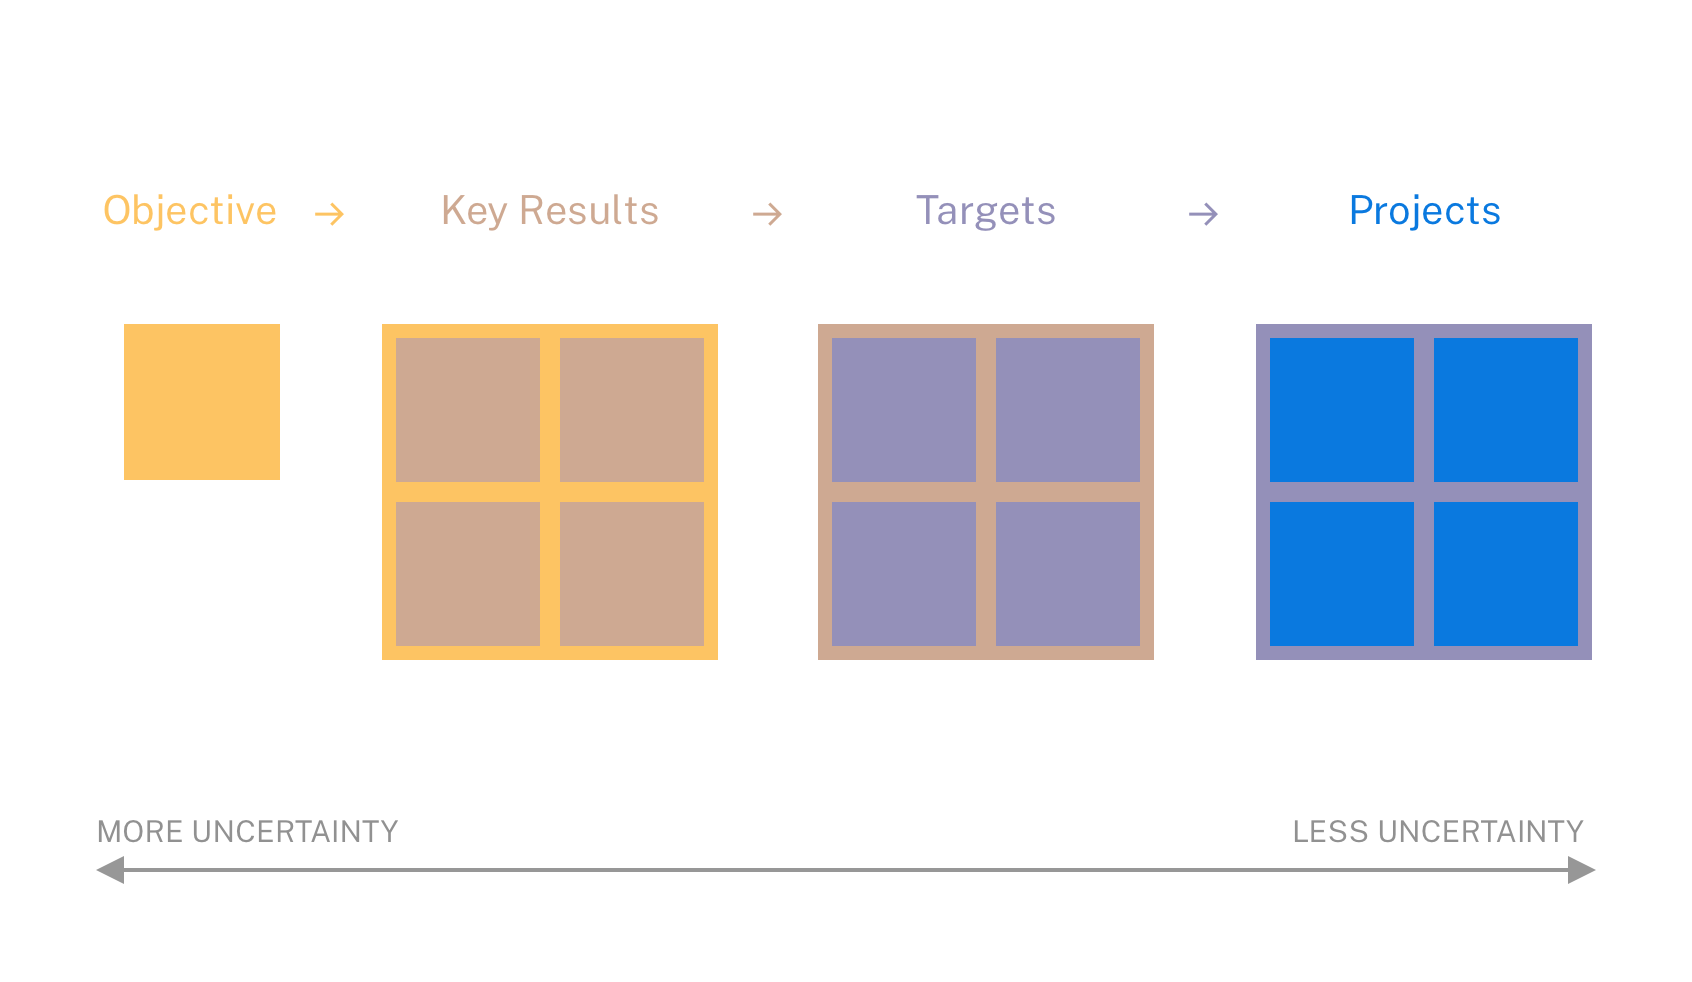
A responsive roadmap consists of four elements:
- An ambitious objective that guides all the work your team is doing,
- Measurable key results that tell you if you’re on the right track,
- Concrete targets that will move the needle of your key result, and
- Current projects that you have undertaken to reach your next target.
Your responsive roadmap is a snapshot of your current work, as well as a model of how you’ll process uncertainty over time.
A responsive roadmap is not a sequence. The team can work on a task, condition, key result, and objective simultaneously. For instance:
Objective: Make our checkout flow feel instantaneous
Key Result: 99% of checkout sessions last less than 5 seconds
Target: Billing details form should load in 100ms
Project: Remove jQuery3 dependency
Each step in a responsive roadmap includes an increasing amount of uncertainty. As you move from projects out to missions, exactly how and when you’ll achieve that goal become fuzzier.
In our example, I can say with a high degree of certainty exactly how I’ll remove our jQuery dependency, and that it’ll take a few hours.
The team’s next target, loading the billing details form quickly, will probably involve a few more projects, but we can’t say for certain if it’ll take a few days or a few weeks.
We’ll need to plan a few more targets to get to a 5-second checkout process, but we’ll be learning a lot before we accomplish the desired result. Along the way, another team might help us by improving our design system, so our plans will need to change. Knowing what we don’t know, it’s in our best interest to not spend too much time planning that far out.
Finally, we’ll only have an instantaneous-feeling checkout flow if we do everything else right. If we commit to that mission and use it to align the rest of our work, we can continuously make progress and report back.
How to create and publish a responsive roadmap
Creating a responsive roadmap doesn’t require fancy software. All you need is:
- An accessible record of your roadmap - Google Docs, Confluence, or Miro work great.
- A short recurring meeting to update your roadmap - an hour every month should be sufficient. If you’re working in sprints, time your roadmap meeting with your working rhythm.
During your first few meetings, walk through the following statements in order:
- We know what our objective is.
If false, spend the meeting defining objectives. If true, continue → - We have a measurable key result that will tell us if we’re on the right track.
If false, spend the meeting defining key results. If true, continue → - We have a concrete target that will move the needle of our key result.
If false, spend the meeting defining targets. If true, continue → - Everyone has a project to work on to get to our next project.
If false, spend the meeting defining projects. If true, the meeting is over!
After you’ve written down your first objective, key results, targets, and projects, you’re ready to publish your roadmap. If you’re using a cloud-based tool, make a short, easy-to-remember link to your roadmap. If you’re working offline, use something ephemeral like a whiteboard or large post-it.
After you’ve published your roadmap for the first time, keeping it up-to-date is simple. At your regular roadmap meeting, run the previous statement in reverse order:
- We know what projects we’ll work on next.
If false, define more projects to hit your next target. If true, continue → - We know what target we’ll work on next to move the needle of our key result.
If false, define the next target for the team. If true, continue → - Once we achieve our current key result, we know what key result we’ll seek next.
If false, define the next key result. If true, continue → - Once we accomplish our current objective, we know what objective we’ll focus on next.
If false, define your next objective. If true, congratulations! You’ve planned all you need to plan.
Add your changes do the document, and you’re up-to-date!
In this mindset, the team is always working one level of uncertainty ahead. Practically, teams will spend almost all of their time defining projects. But when the team closes in on a target condition, key result, or objective, they’ll be prepared to transition seamlessly to the next.
Crucially, continuous integration removes the need for onerous quarterly roadmap planning. At any time, any member of the organization can look at the responsive roadmap to get see what the team is working on now, where they’re headed, what results they are driving, and their high-level initiative.
How to use a responsive roadmap to align
Different levels of your responsive roadmap are useful for coordinating at the various levels of your organization.
- Objectives are useful for connecting your work to a high-level organization vision, your so-called “north star.”
- Key Results, when written well, coordinate your work with the strategic initiatives of executive stakeholders. Key results create accountability without succumbing to Goodhart’s law.
- Targets create alignment across functional groups: at Bitly, they tell marketing and sales teams know what to expect from feature teams. Targets also map neatly to what agile software development calls an epic.
- Projects align teammates day-to-day. Projects also map to what agile software development calls stories…They answer the question “what are you working on?” with a pull request (just check Jira!) rather than a synchronous status meeting.
What about deadlines?
Due to its complexity, software development is notoriously difficult to estimate. But businesses need deadlines to plan many vital functions — it’s a good thing that I get my paycheck reliably on the first and fifteenth of the month. This is one of the most challenging parts of planning software development. We know our estimates are bad, but we have to make them anyway.
Avoid putting deadlines on Objectives and Key Results. Most teams just can’t know if they’ll strike gold and surpass their goal quickly or get stuck in a quagmire of technical debt and shifting requirements. Constant learning and re-evaluating is part of great teamwork, and deadlines tend to put a damper on experimentation and innovation.
Instead, put your targets on a calendar. Since these targets will likely be a few cycles out (weeks to months), teams will have enough time to coordinate go-to-market and customer support plans.
All maps are wrong, but some are useful
The statistician George Box said that “all [statistical] models are wrong but some are useful.” The same is true for maps. All maps are right in some regard (the Mercator projection’s straight lines across the Atlantic ocean), but wrong in others (the Mercator projection’s continents).
Traditional project roadmaps are right about our knowledge in a moment of time. They are good records of our beliefs about the correct sequence and magnitude of our work. But these roadmaps are wrong about the reality of work, and almost every roadmap I’ve ever used goes out the window as soon as the work starts. No battle plan ever survives contact with the enemy.
Responsive roadmaps are right about the nature of work: it is full of uncertainty and subject to change. They are wrong about what we’ll be doing in the future; the farther out we look, the less accurate a responsive roadmap is. That tradeoff affords us time to focus in the present on delivering at the highest level of quality.
Special thanks to Laura Hahn and Josh Petersel for contributing to early drafts of this essay.
My favorite tool for un-learning the biases of the Mercator Projection is the website The True Size Of. The default view — showing that the area of China, India, and the contiguous US all fit within the landmass of Africa — is stunning. ↩︎
This is a reference to the Responsive Manifesto, an attempt to describe modern organizational tensions. ↩︎
jQuery is a third-party javascript library that used to be essential in web applications. ↩︎