I like writing and sharing essays on twitter. I especially like the way the link previews look when they have images that stand out in the timeline. In the past, I’ve created illustrations for each of my posts. But I have two problems: 1. Creating illustrations takes time, and 2. I’m not good at it.
Fortunately, Zach Leatherman wrote up a potential solution to my problems: his site automatically generates nice-looking images that include the title, date, and site name. But I’m a glutton for punishment. I wanted to take it one step further. A terrible idea stuck itself in my brain:
What if each preview image was a piece of generative art?
Slowly and painfully, over the course of a month, I hacked away until I had shipped this terrible idea. My website now makes nice pieces of generative art for each post, so I can share them with my friends on Twitter.
So that I didn’t suffer in vain, I thought I’d write up my process and share the code, in case you’re also interested in unnecessary complex solutions to first-world website problems.
Let’s go!
Making generative art
When I started this adventure, I didn’t know much about making generative art. I follow some amazingly talented creative coders on twitter (like Tyler Hobbs, George Francis, and Ben Kovach), and I’d dabbled with generative algorithms in previous versions of my website. But getting interesting results would take a lot more than just a simple algorithm.
Previous examples of generative art on my homepage
Flow fields
Tyler Hobbs’ essay Flow Fields was the kickstart I needed. In it, Tyler walks through the basics of flow fields, a concept at the heart of many pieces of generative art.
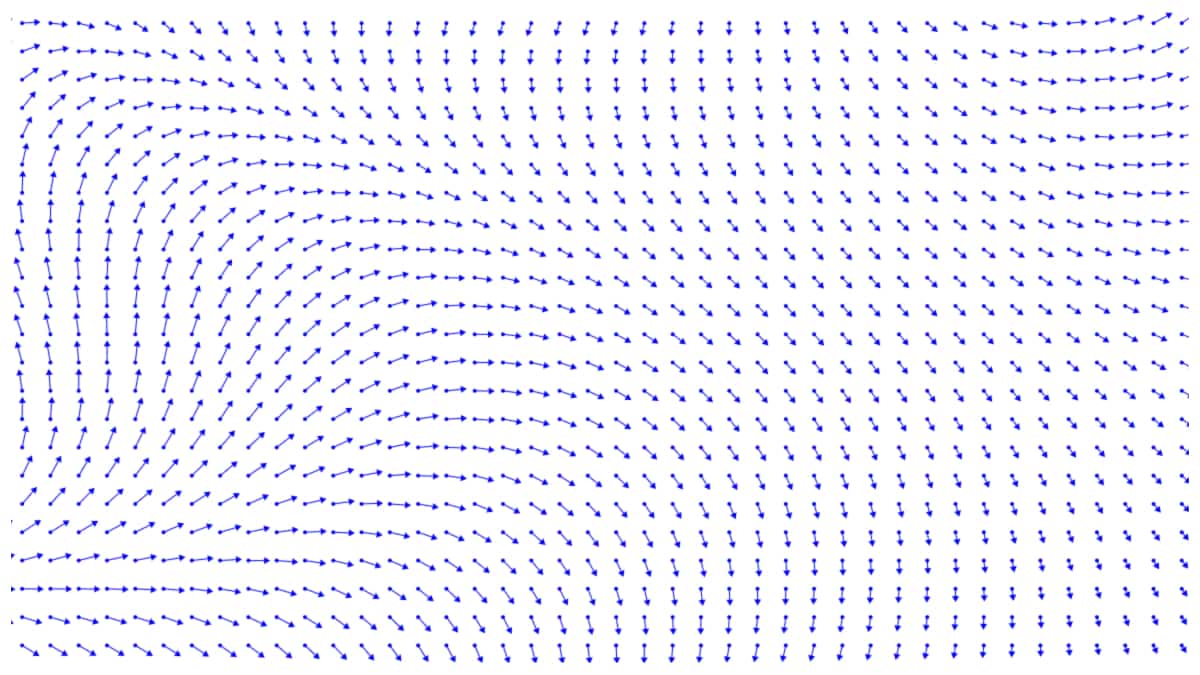
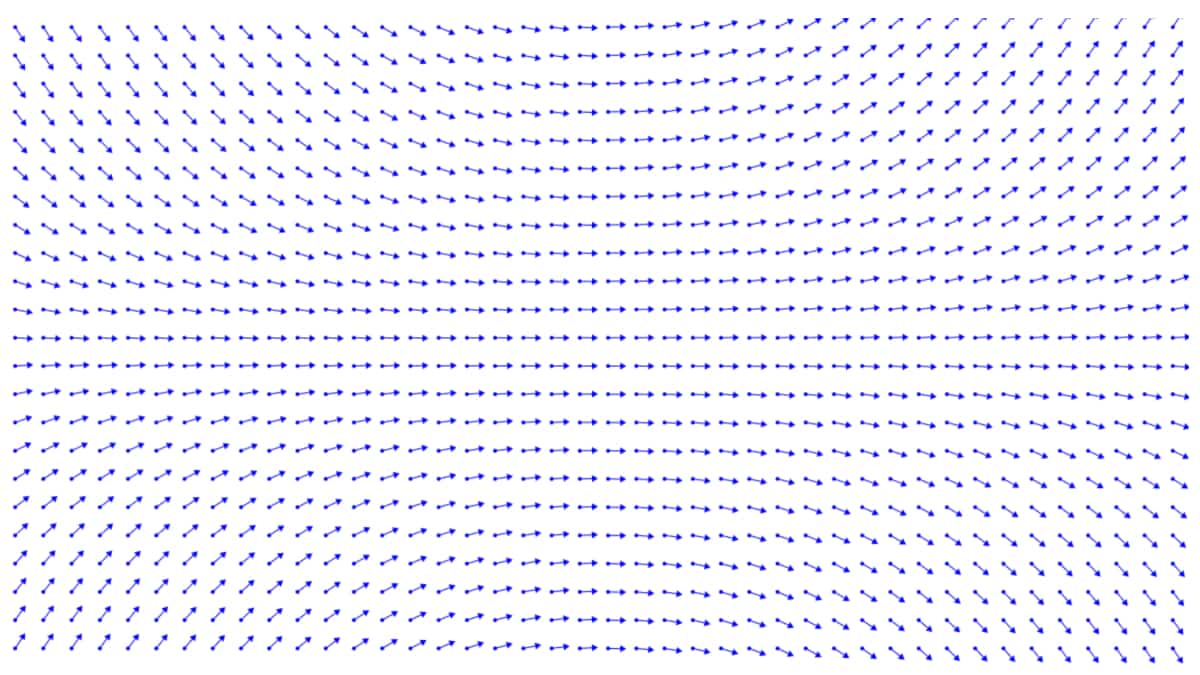
A flow field is a kind of map; for every point in the space, the flow field has an arrow pointing in some direction. The arrow represents a force like a current or a magnetic field. So, if the space is an ocean, the flow field is like the waves on the surface showing which way the wind is blowing.
A flow field. The arrows show which direction the field is moving at that point.
That means a flow field is essentially a function. The input to the function is a point and the output is a vector.
A flow field function can be as simple as setting assigning the same vector to every point in the field:
The math notation might be unfamiliar, so here’s the same function in javascript:
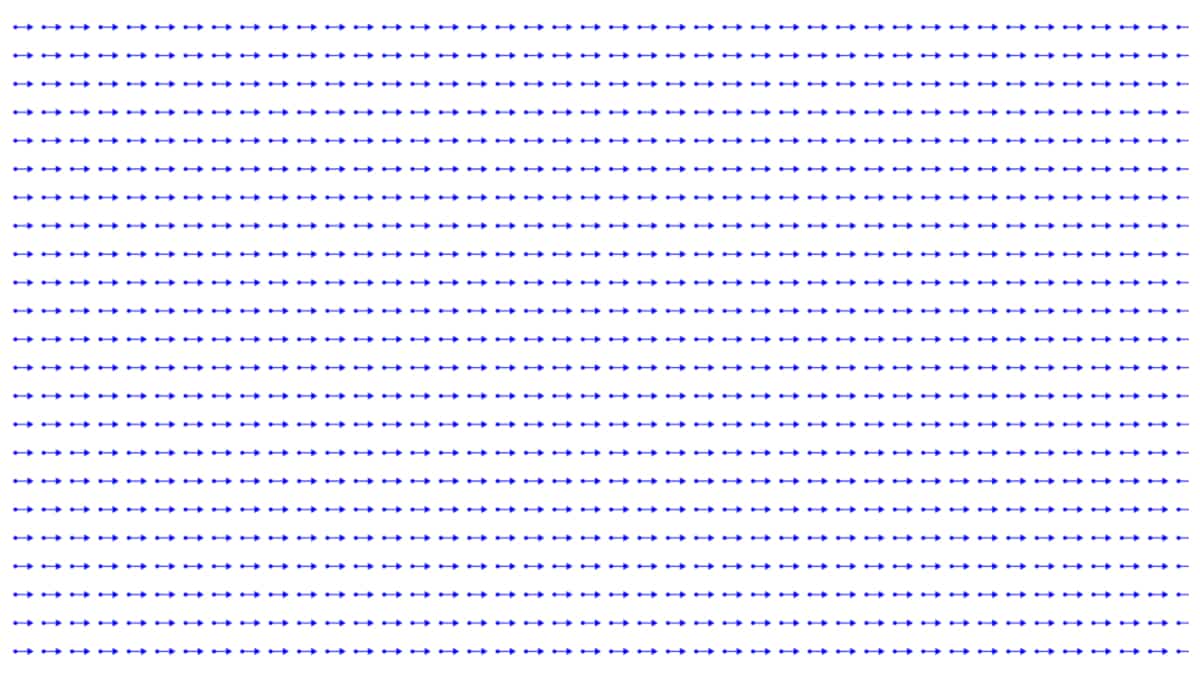
functionvectorAtPoint(x, y){return[1,0]}
This flow field is not terribly exciting, though.
A flow field where every vector points one unit to the right
To make things more interesting, we can make use of our input coordinates when calculating the output vector. Take this function, for example:
Where WIDTH and HEIGHT are constants defining our space’s width and height. Here’s how that looks:
A flow field where every vector’s angle is defined by a trigonometric function
Groovy.
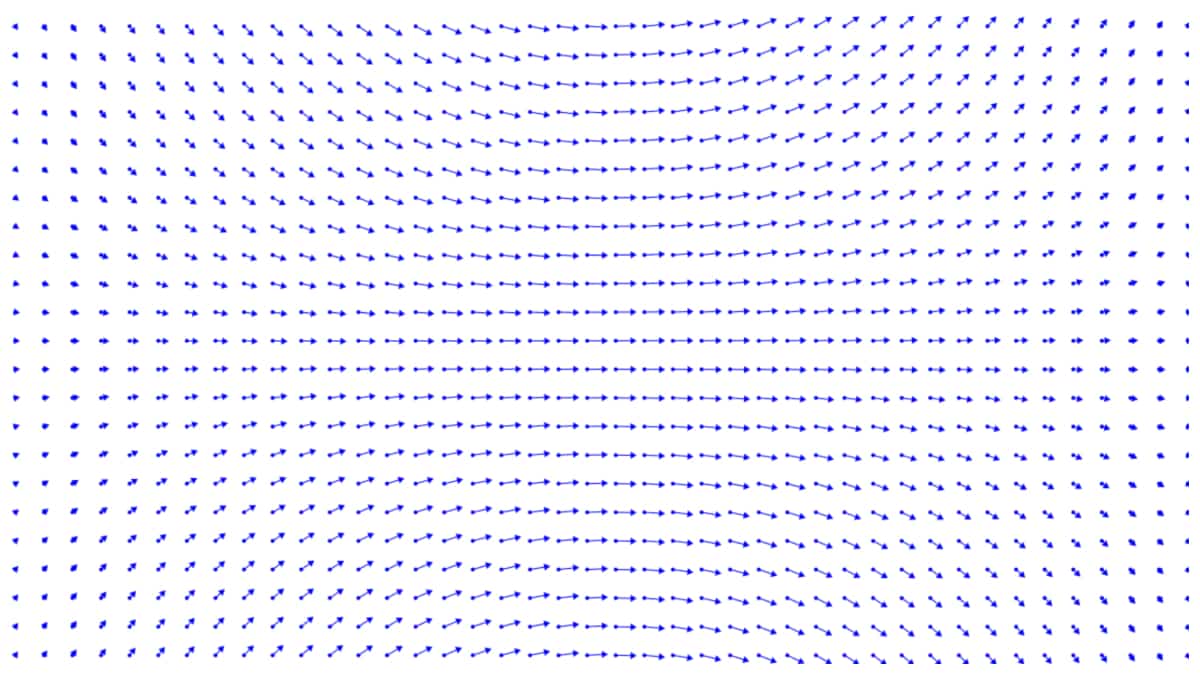
You probably have noticed that the vector returned by our function has, until now, taken the form of [1, t] where t is some angle in radians. If we vary the first term instead of holding it constant, we get even more interesting results.
A flow field where every vector’s angle and magnitude are defined by trigonometric functions
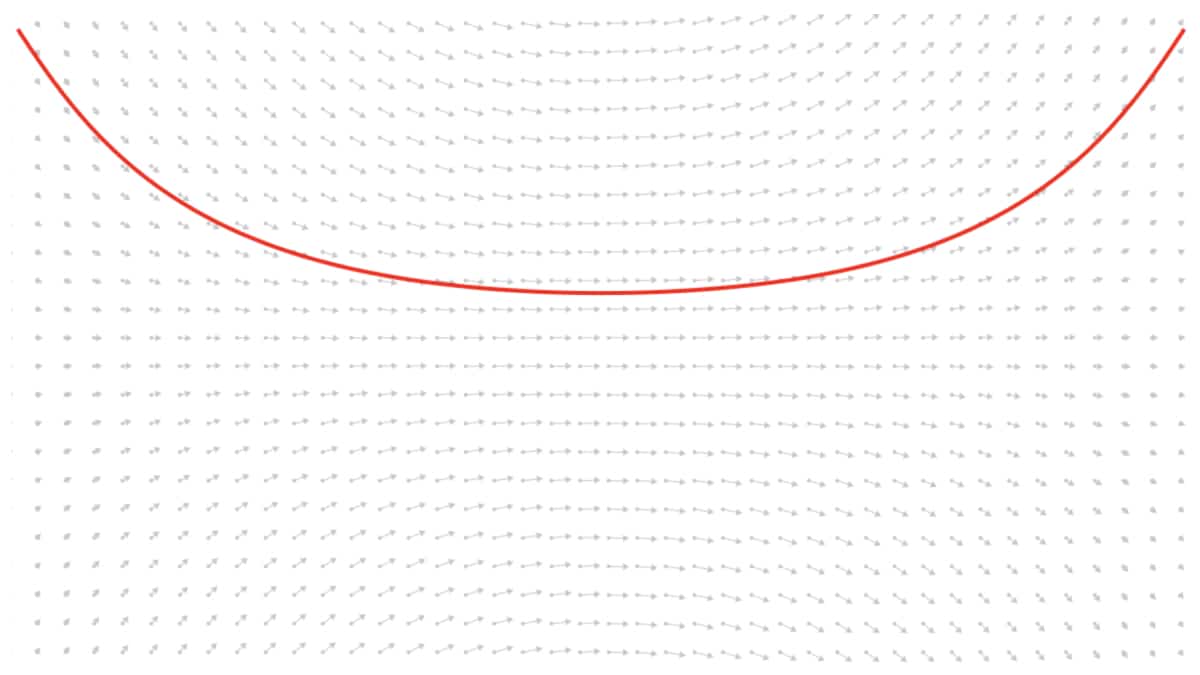
If we draw a line through this field, letting the vectors indicate how far and in which direction to move as we go, we get something like this:
A line moving through a flow field
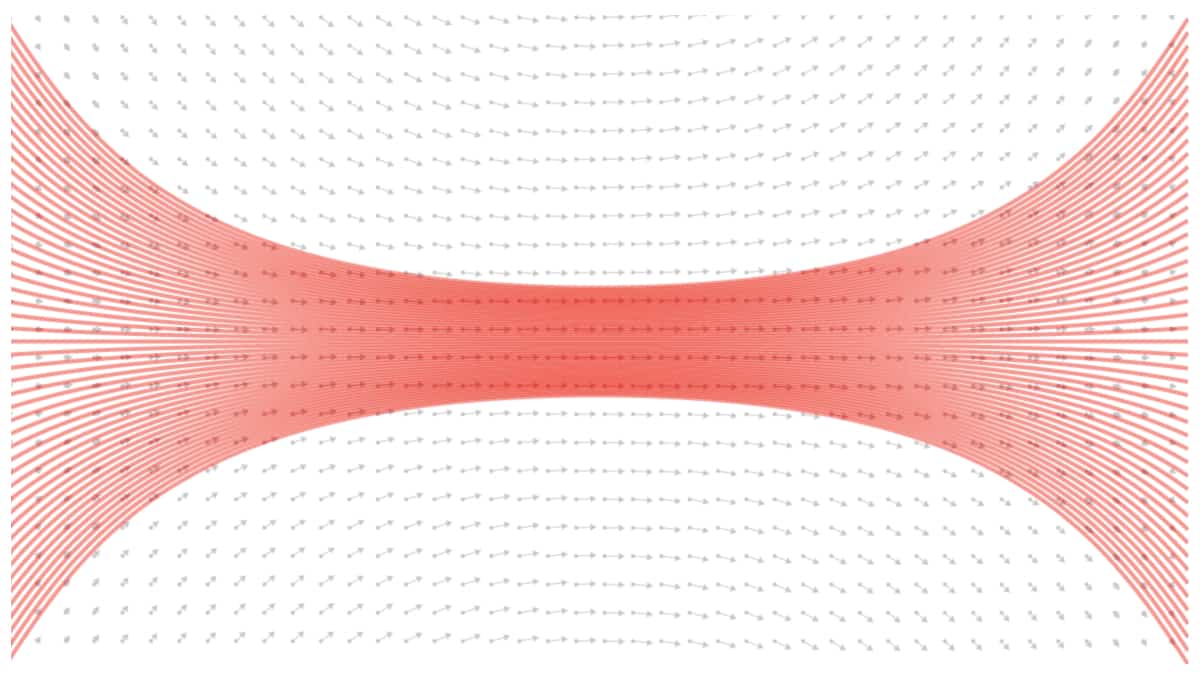
And if we draw a whole lot of lines through the field, we get some interesting shapes and patterns:
Many lines moving through a flow field
Noise
While generative art involves a lot of math, it wouldn’t be very interesting if it only followed perfect math equations. Generative artists employ randomness to give their work a more organic, unpredictable, and therefore more interesting effect.
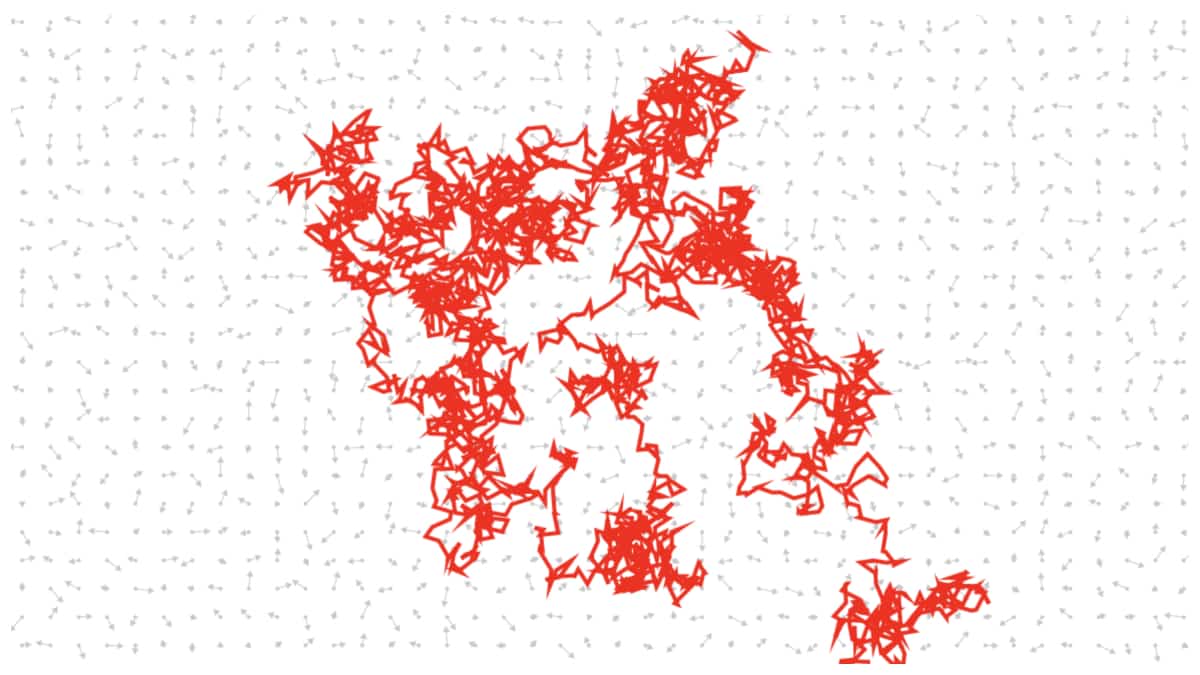
Unfortunately, simply picking a random direction and magnitude for each point in the flow field doesn’t result in aesthetically pleasing results.
A line moving throw a flow field where every vector is randomly generated
That’s because complete randomness is too random.1
In nature (at human scale, at least), things don’t zigzag wildly and at sharp angles; they curve. So how can we produce random smooth curves? This exact problem was tackled by Ken Perlin when working on the 1982 movie Tron. His solution produced such impressive-looking computer graphics that he won a special Academy Award, for enabling “computer graphics artists to better represent the complexity of natural phenomena in visual effects.”
I won’t go into the details of the Perlin noise algorithm, or its more modern successor, simplex noise.2 But substituting the simplex noise function for our random number function above, we get the following:
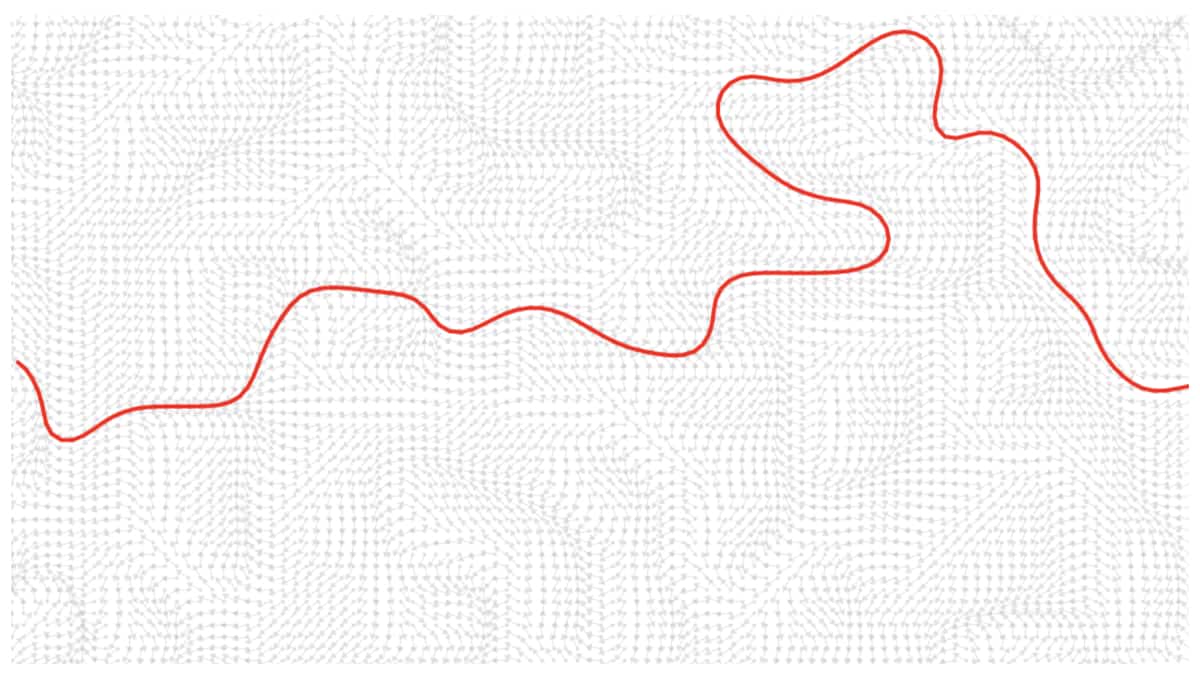
A line moving through a flow field determined by simplex noise
Bingo. We see those nice natural shapes emerging, like the path or a river through the landscape of our flow field.
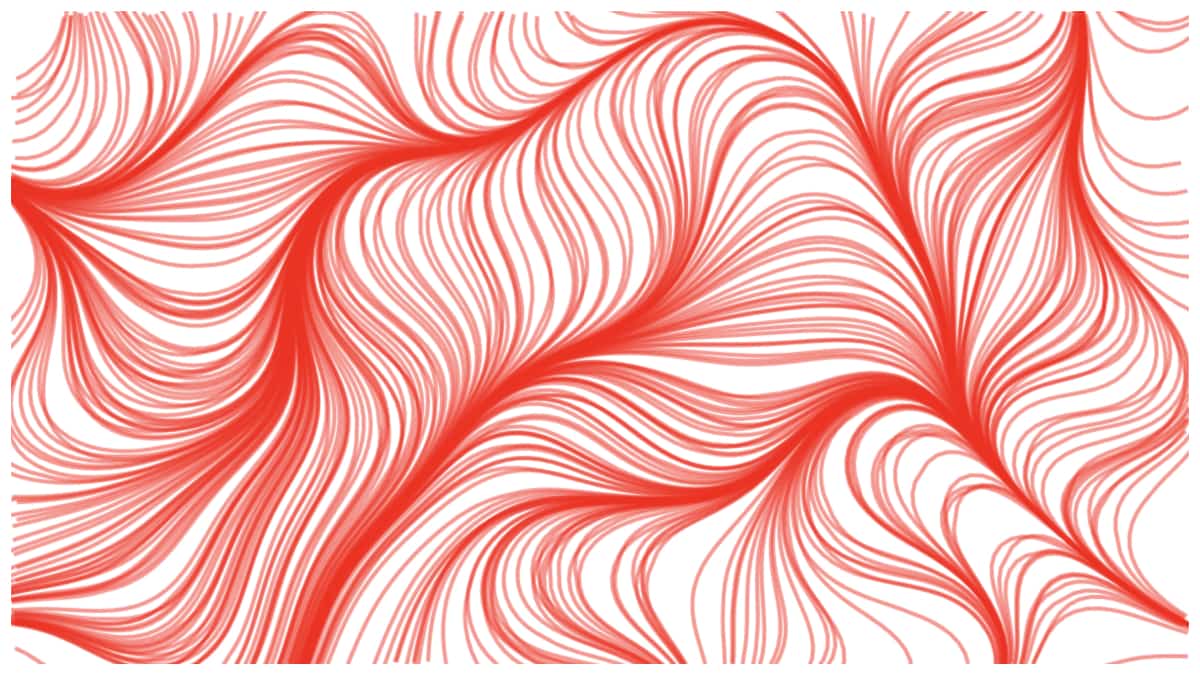
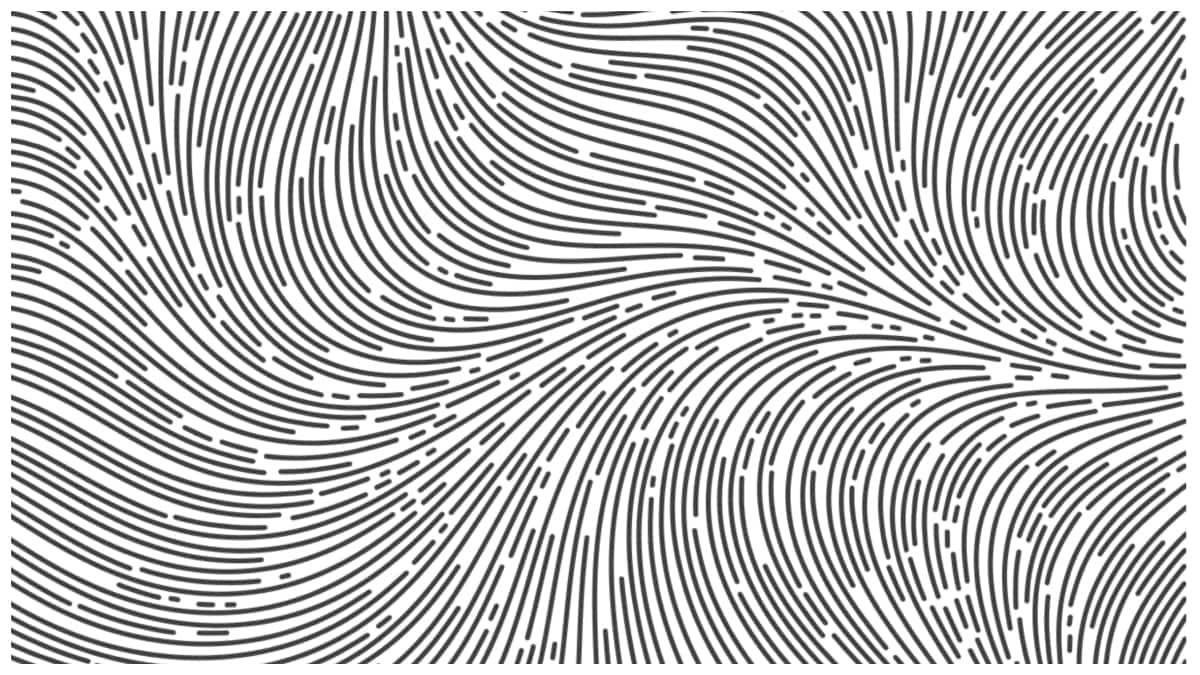
Adding in more lines, and adjusting the scale of our noise landscape a bit, you can see how simplex noise leads to such pleasant-looking images.
Many lines moving through a flow field determined by simplex noise
Evenly-spaced lines
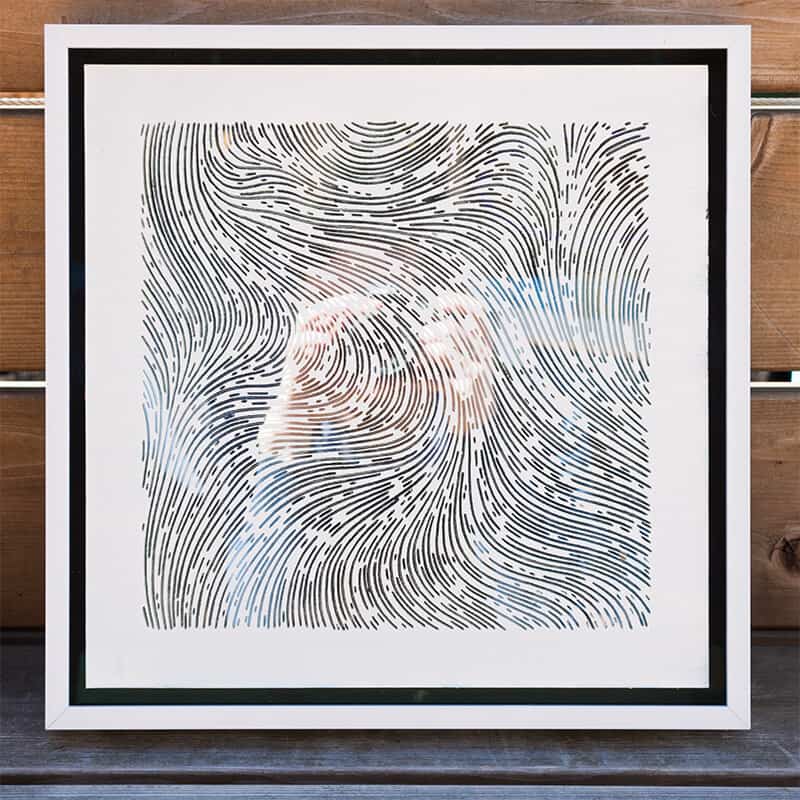
One of the works I’ve been most inspired by was Tyler Hobbs’ Mirror Removal #5 (White). The lines in the piece are evenly spaced, creating a consistent texture throughout the piece.
Tyler Hobbs’ Mirror Removal #5. Image by Tyler Hobbs
Jobard and Lefer’s technique requires two separate algorithms:
An algorithm that draws lines that do not intersect. There are a number of ways to do this, each with performance and complexity tradeoffs. My preference is a method I learned from Daniel Schiffman’s Coding Train video on Poisson-Disc sampling: essentially, store points you’ve drawn in a grid data structure, then use that data structure to efficiently check for nearby points before drawing a line segment.3
An algorithm that creates a “queue” of points to start lines from. This is where Jobard and Lefer make their unique contribution: while drawing a flow line, occasionally pick points a consistent distance away from the current line, and stash them in a queue. When you finish your current line, jump to a random point in the queue and start drawing a new line. Again, Schiffman’s video on Poisson-Disc sampling has some very applicable lessons.
Putting those two together, I got really nice results.
Lines drawn through a flow field using Jobard and Lefer’s technique
The finishing touches: colors, shapes, and scale
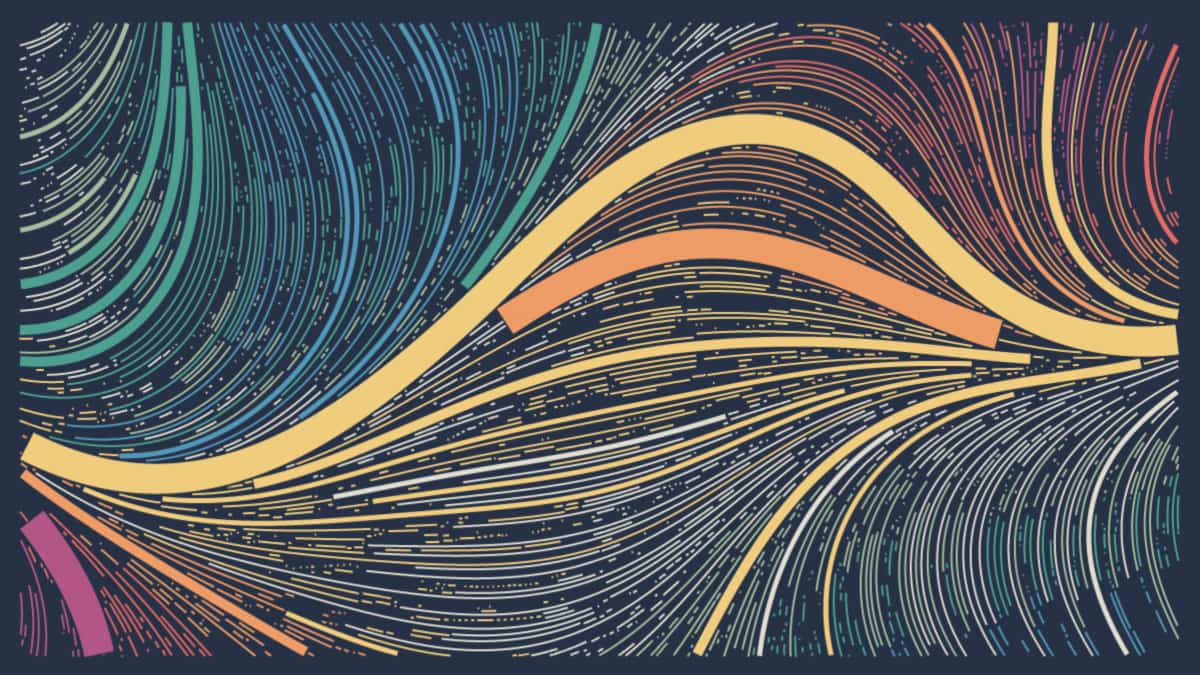
Adding additional variables to the equation creates possibilities for each image to have its own character. I’ve previously written about algorithms for picking colors, and many of those strategies can be applied to generative art. For this application, I used the same color scale that’s at the foundation of my VS Code syntax theme, Little League.
I also randomly varied the scale of the flow field, the size of the lines, and how densely packed the lines are.
Images generated by my algorithm with variations in color, line size, and noise scale
At that point, I had accomplished a lot — all told, I’d wager the art algorithm alone took around 100 hours of coding.
However, this was only half of my goal. The other half would really stretch my technical abilities; it’s where the greatest opportunities for improvement still lie.
Making Open Graph images
In order to use these images to accompany my website’s previews, I’d need to wade into automation. Sure, I could hand-pick the background image, mock up the preview image in Figma, and serve it alongside my site. But that would be far too easy, and wouldn’t involve painstakingly learning how to automate a browser.
Taking a screenshot
Open Graph image generators like Github’s and Vercel’s generally approach the problem from the same angle:
Use the metadata from the page (like the title, subtitle, and date) to generate some HTML from a template
Pipe that HTML to a browser and use an automation framework to take a screenshot
Serve up the screenshot in the original page’s <head> tag
The first step is pretty straightforward. Since I wrote the generative art algorithm in javascript, it’s just a matter of bundling it up into a self-contained blob of html with webpack. I also added a few lines to grab the headline and subhead from the URL; these are used as the seed values for the algorithm’s random number generator. The headline and subhead are injected into the HTML via inline javascript and styled with good ol’ fashioned CSS.
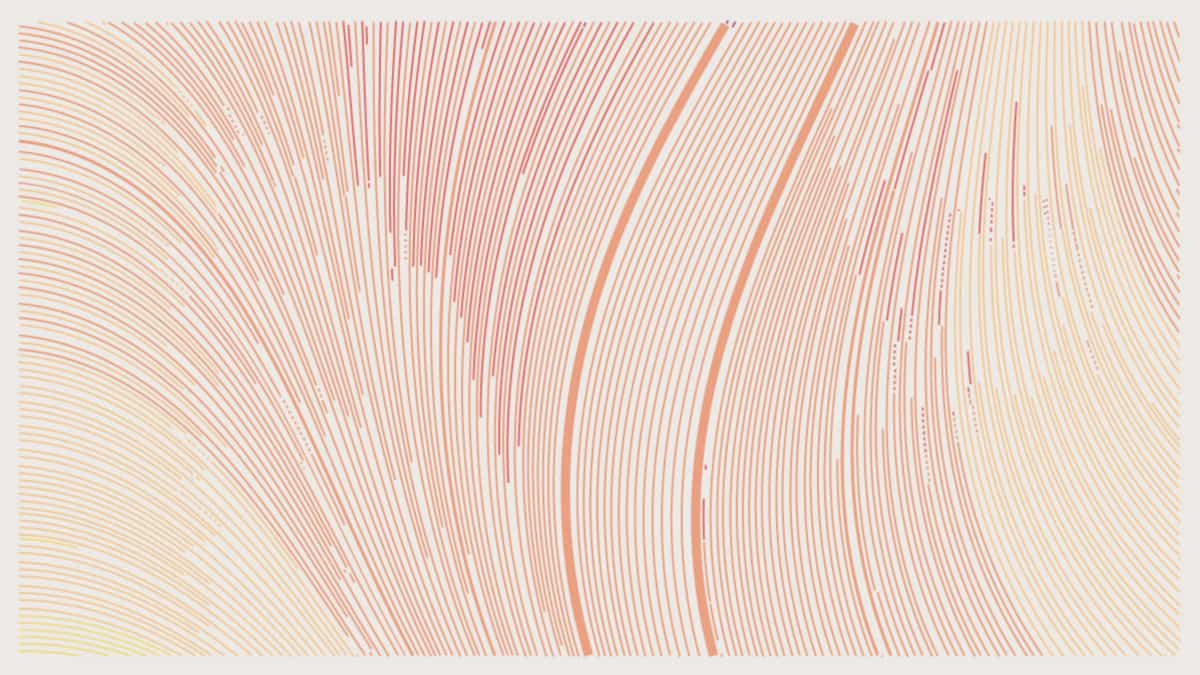
If I visited my template in a browser from the URL ending in /headline=Test%20Headline/subhead=Test%20Subhead, I got the following:
An example of the algorithm using the headline as a seed for the random number generator
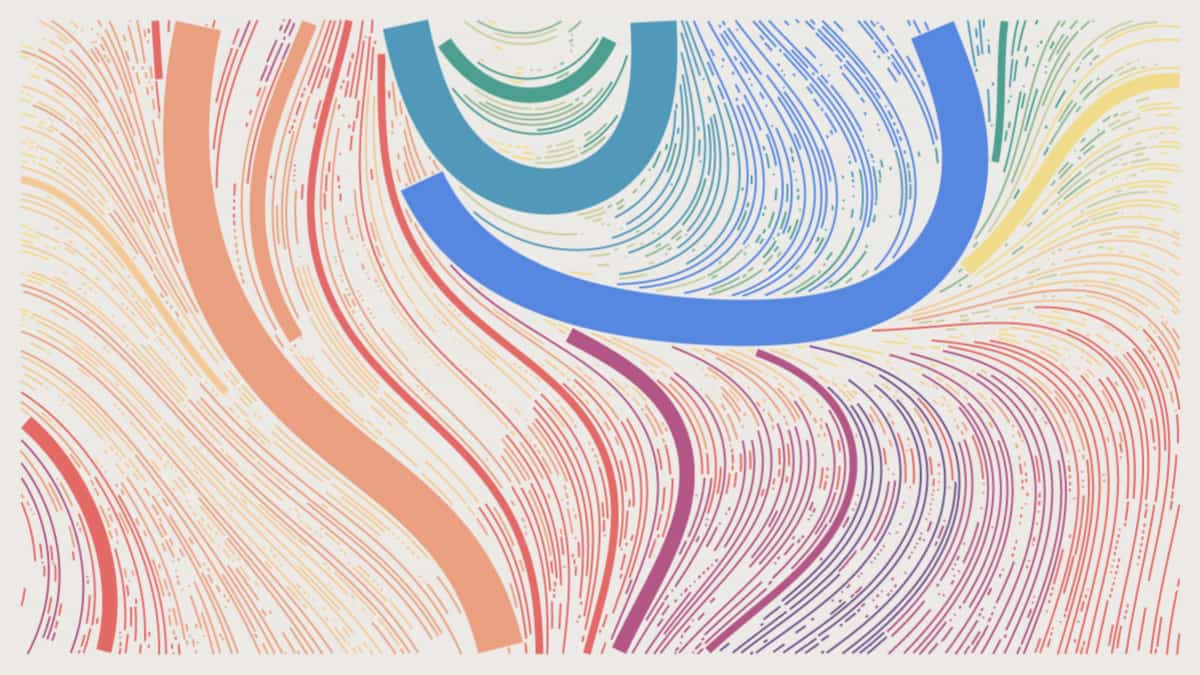
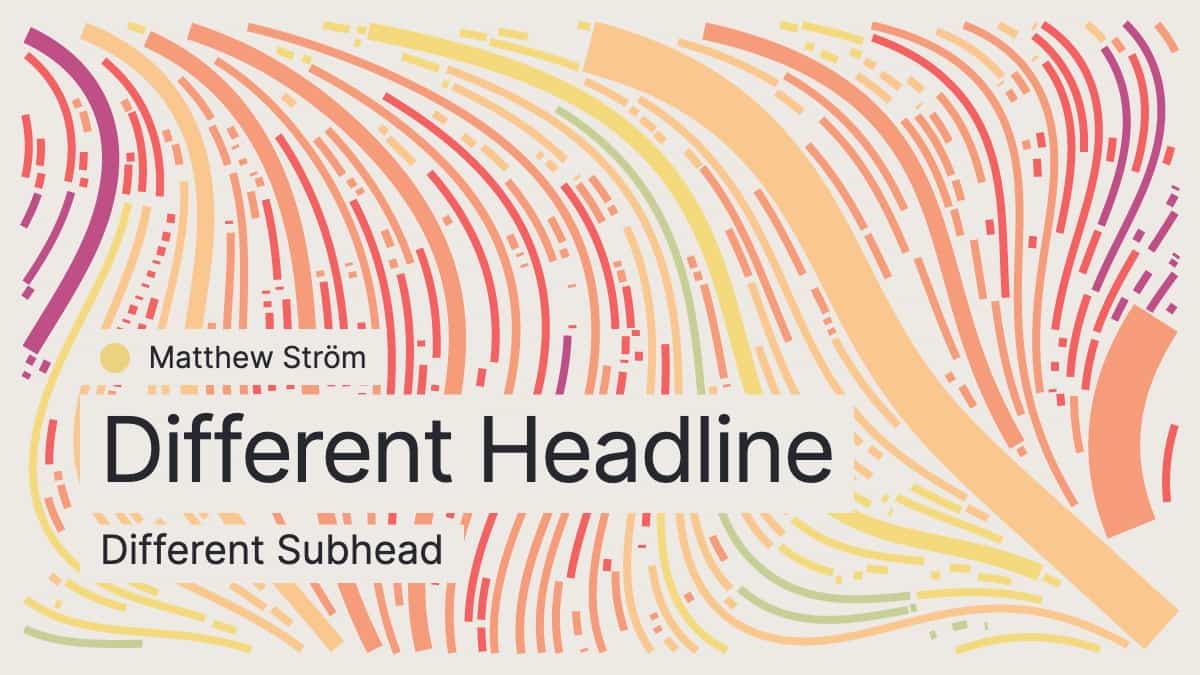
But the same page, accessed from a url ending in headline=Different%20Headline/subhead=Different%20Subhead, resulted in this image:
An example of the algorithm using the headline as a seed for the random number generator
Unfortunately, this wasn’t an image yet — it was an HTML page rendered by the browser. Since Open Graph images are … well, images … they need to be something like a .jpg or a .png. Following in the footsteps of other (more talented) developers, I used Puppeteer.
Puppeteer is an automation tool for the Chromium browser engine. With a few commands, you tell Chromium to load up a blob of HTML, and take a screenshot.
let htmlPage = fs .readFileSync(`${__dirname}/template.html`) .toString()
Ok, finally on to step three: serving the screenshot as an image.
I decided to host the screenshot-taker as a serverless function, because I don’t actually know how to maintain a server-ful function. I figured I’d let Netlify handle the gory details for me.
This meant jumping through a few extra hoops. Puppeteer needs an instance of Chromium to work with, which is a little more than serverless functions are meant to handle. Fortunately there’s a version of Chromium designed to run on AWS Lambda, Amazon’s serverless function service; this works seamlessly with Puppeteer in Netlify’s own serverless functions.
With code to load in the font and parse the URL parameters, I could take the screenshot and run the following to serve it up as an image:
After a lot of debugging, and a little crying, I had a Netlify function that made generative art images from URL parameters.
The final result of the fully-functional image generator function
I was done!
… Right?
Solving performance issues
As far as websites go, my serverless function is not the speediest. This isn’t terribly surprising; every time it gets a request, the serverless function boots up chromium, waits for the page to load, takes a screenshot, and sends it as a response. This can take up to two seconds, depending on variables outside of my control.4
This might have been ok, since Netlify keeps the network request open while it does its work. A browser or server asking for a post’s image just has to wait a second or two, like in the old days of the internet. But in my testing, I found that Twitter in particular gets impatient with the function; it hangs up the connection and doesn’t download the image if it’s taking too long. Plus, if the function runs more than 125,000 times a month, I have to pay Netlify for a higher tier of service. While I love Netlify, I would like to avoid the expense.
The thing is, these images don’t change very often (maybe never). Once a post’s image has been rendered, I shouldn’t need to run the function again to retrieve it. If I were a better developer, I would figure out how to cache the images on the server(less) side. But I’m not that clever.
Instead, I used Zach Leatherman’s eleventy-img plugin. When my site is built in production, Eleventy downloads an image for each post on the site that needs one. It saves that image into the build directory, then pipes the filename/URI into the relevant meta tag in the post’s <head> tag.
This has the added benefit of making sure my Open Graph images still exist, even if the Netlify function stops working (or, in my case, when I accidentally disable it by changing the environment settings).
In the end
All in, I spent over 200 hours across multiple months to get to this point. All the various functions and templates add up to a scant 500 lines of code; almost every single one challenged my abilities as a hobbyist coder.
It may seem like overkill to write a serverless generative art algorithm to get some pretty pictures that only show up when folks paste links to my site into Twitter or Slack. It probably won’t result in a deluge of new traffic, or make my writing go viral. But over-engineering complicated solutions to simple problems is my love language.
Pursuing technical challenges, no matter how seemingly sisyphean, is a great way to learn. And the feeling of accomplishment when you finally get the boulder up the hill is priceless.
Github and Vercel both address these performance issues in their own implementation of this concept. Github manages to squeeze an extra ~400ms out of Puppeteer by using domcontentloaded instead of waitUntil. Vercel ended up completely abandoning Puppeteer altogether. Both approaches are a little outside my technical comfort zone. ↩︎